
Every figure carries its source and date.
Quantitative claims identify the source and the date to which it is current. Published figures and our own estimates are distinguished.
Inspect the source logEvery figure sourced and dated
Original research for complex decisions in markets and public policy. Check every source and test the model's judgements yourself.
272 data centre tranches, mapped from the public record
Planned or proposedUnder constructionOperatingNot proceeding
In orange: DC-155 · Firmus Project Southgate, Launceston (St Leonards).
The inashanu register follows 272 tranches in 230 data centre campuses as at 21 October 2026, each with its recorded status and the date of the record that sets it.
DC-155, in orange, is Firmus Project Southgate at Launceston (St Leonards), recorded as under construction at 84 MW as at 8 October 2026.
26 GW planned or proposed, 3.3 GW under construction
Planned or proposedUnder constructionOperatingNot proceedingNo IT figure published
In orange: DC-155 · Firmus Project Southgate, Launceston (St Leonards).
| Recorded status | Tranches | IT capacity | Tranches with no IT figure published | Largest tranche |
|---|---|---|---|---|
| Planned or proposed (approved, lodged, planned, announced and paused) | 111 | 26,032 MW | 27 | DC-220 · Syncline Energy Victorian AI Hub, 2,400 MW |
| Under construction | 32 | 3,309 MW | 3 | DC-014a · CDC Marsden Park campus, 499 MW |
| Operating | 119 | 1,510 MW | 57 | DC-071 · AirTrunk MEL1, 185 MW |
| Not proceeding (refused, withdrawn and cancelled) | 10 | 250 MW | 5 | DC-131 · GreenSquareDC Hazelmere data centre, 84 MW |
| Location | Tranches |
|---|---|
| Greater Sydney | 95 |
| Greater Melbourne | 61 |
| Western Australia | 30 |
| Queensland | 21 |
| Rest of New South Wales | 16 |
| Australian Capital Territory | 15 |
| South Australia | 15 |
| Rest of Victoria | 9 |
| Northern Territory | 6 |
| Tasmania | 4 |
DC-155, Firmus Project Southgate, Launceston (St Leonards): under construction, 84 MW, as at 8 October 2026. The full register’s public fields are in the data explorer.
Most of the capacity in the register is planned or proposed.
The operating row adds the IT figures published for 62 of the register’s 119 operating tranches as at 21 October 2026; the other 57 publish none. It does not measure operating load and sits outside the pipeline total. National operating IT load was about 1,400 MW at the end of 2025. Source: DC Byte and Data Centres Australia, 27 April 2026.
The work, in the open
Each study is published with the sources and dates its figures rest on: the data centre study with its data explorer, the Firmus analysis with its valuation workbook.
Digital infrastructure
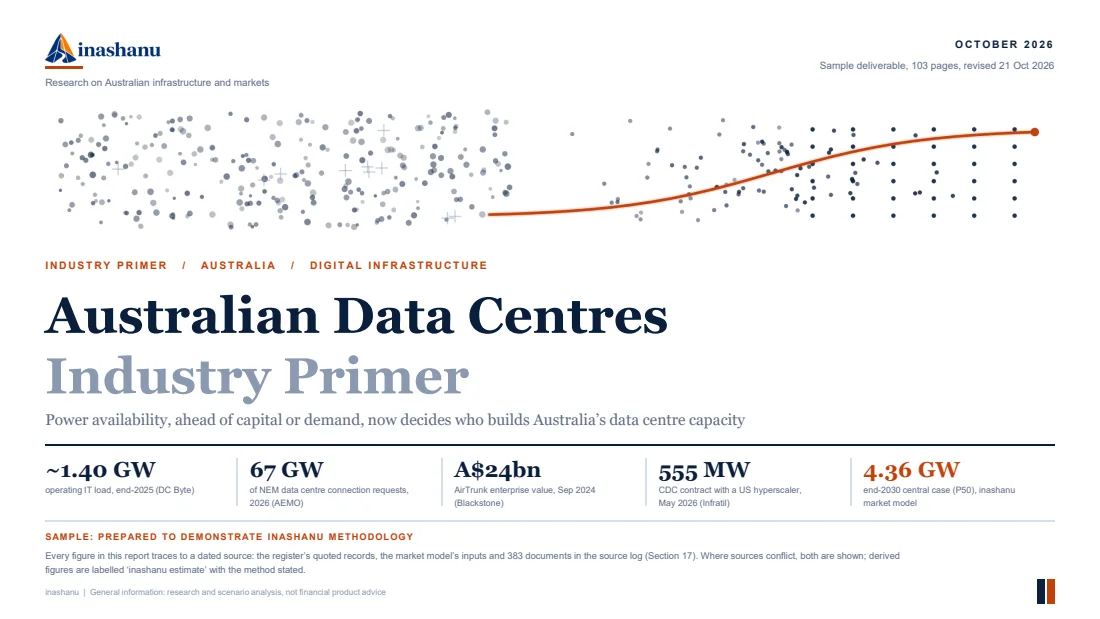
The industry primer counts operating IT load apart from announced capacity, and builds its 2030 range from the tranches in its register.
Read the study103 primer pages
383 logged sources
PDF · Data explorer
Source: the published Australian data centre primer, sections 16 and 17. Evidence current to 21 October 2026. Prepared to demonstrate the standard applied to client work. No client information appears in it.
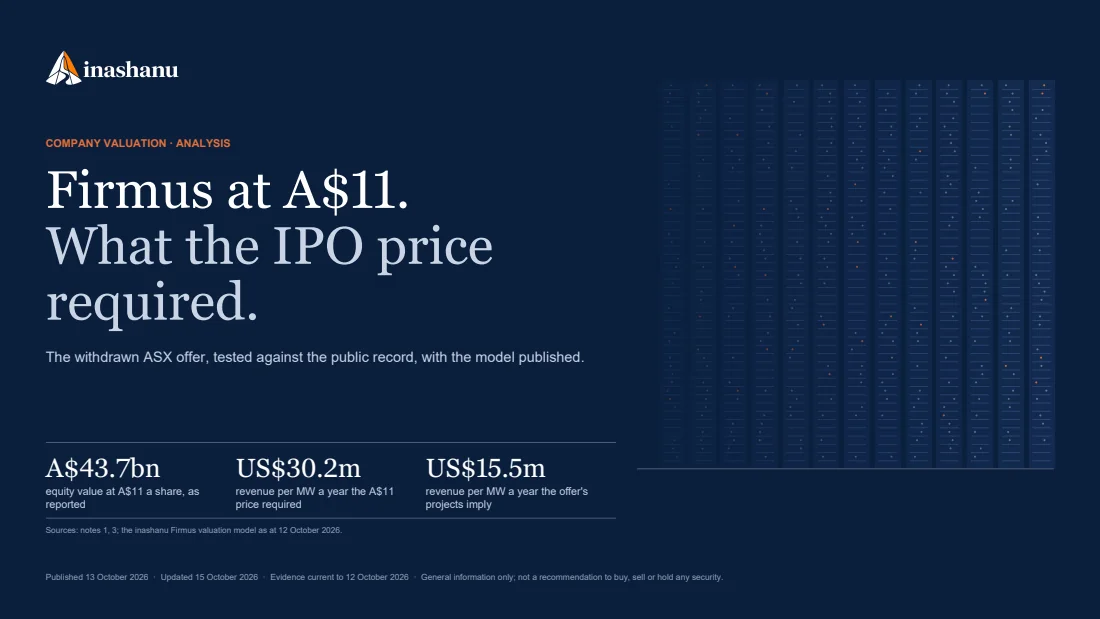
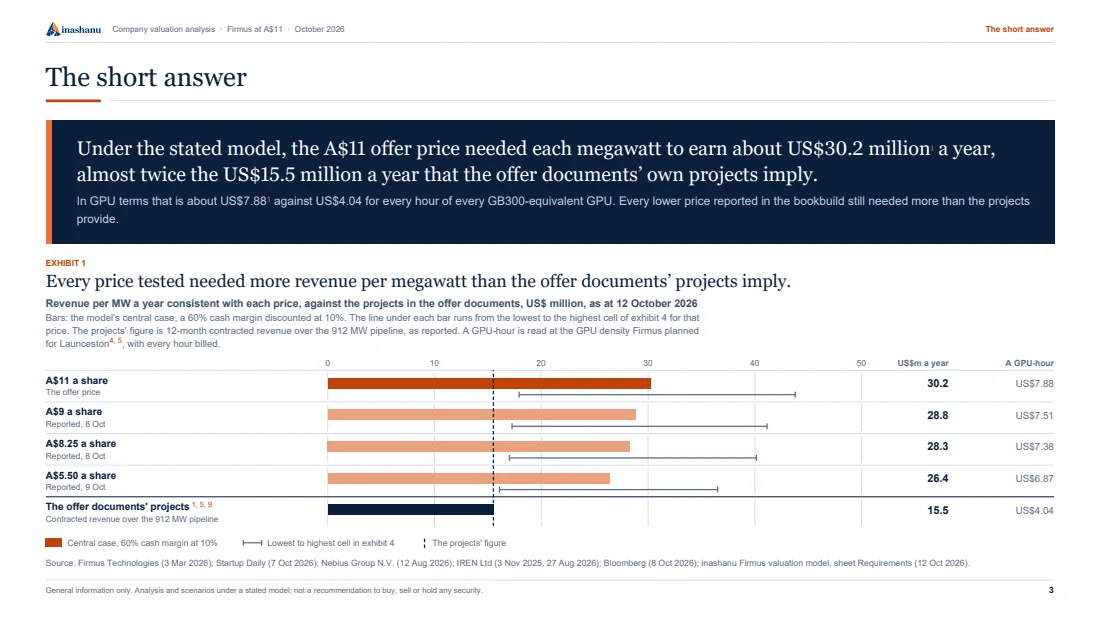
Company valuation
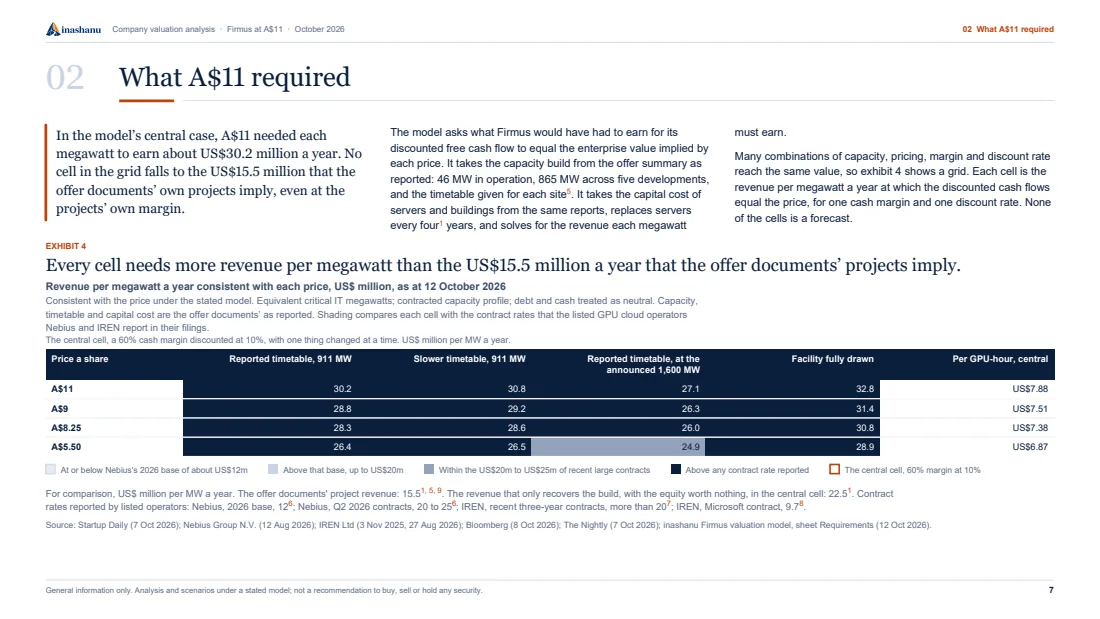
The withdrawn offer, read against its own record: the revenue per megawatt, capacity and funding the price required, with the model published.
Read the analysisData explorer
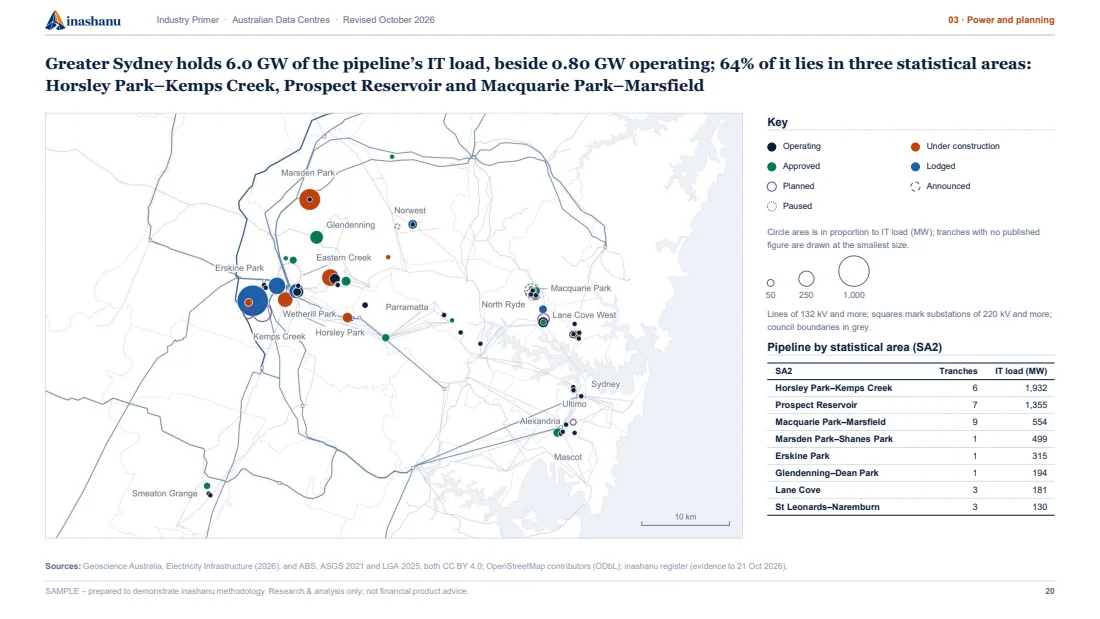
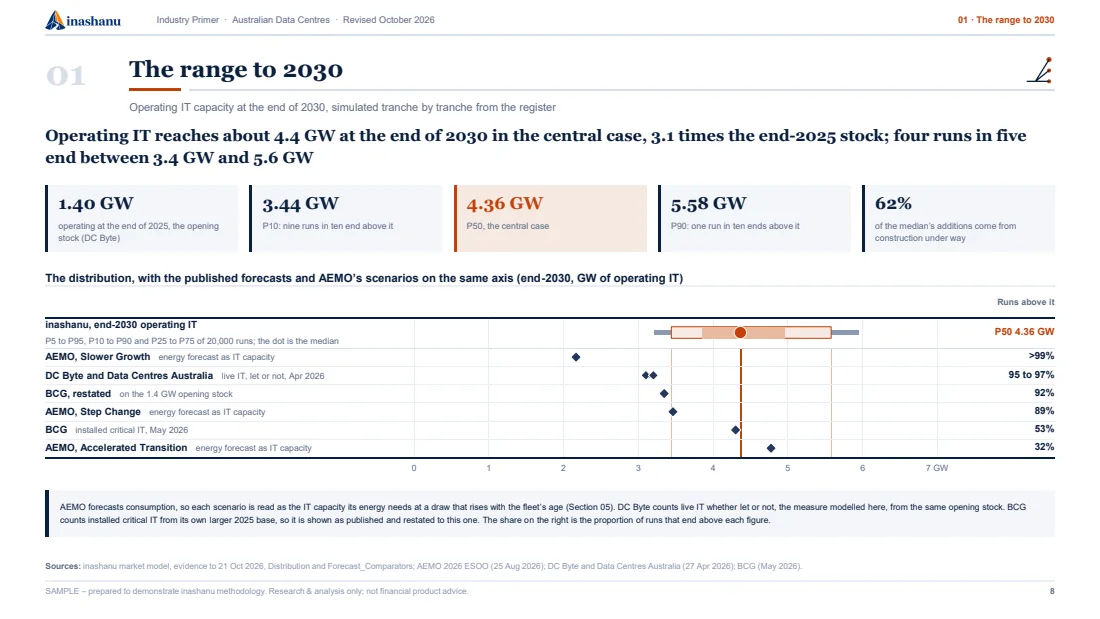
The data explorer maps every tranche in the register against the transmission network, and sets the 2030 range beside the forecasts it is compared with.
 The map: each campus with its status and IT load
 The range to 2030, beside the forecasts it is compared with
Source: the inashanu data explorer, from the register and the market model, evidence to 21 October 2026. Views of the published explorer.
The research programme
Each proposal states its research question and the evidence it would need. A proposed study carries no findings until the work is complete and published.
A proposed geospatial study of grid access and planning for data centres and batteries on urban and industrial sites.
Read the research questionHardware lifetimes, compute pricing and replacement cycles examined through a proposed empirical asset model.
Read the research questionCooling, electrical systems and commissioning services examined as businesses with distinct capacity constraints.
Read the research questionQuantitative claims identify the source and the date to which it is current. Published figures and our own estimates are distinguished.
Inspect the source logEach study states the assumptions behind its scenarios and the basis of every figure. Where definitions differ, the comparison states what each figure measures.
Read a worked exampleThe data-gap register records unanswered questions and their effect on the findings. Conclusions are bounded by the available evidence.
Read the limitationsCommissioned research
For investors and lenders taking a decision to an investment or credit committee, including private equity, infrastructure and private credit funds. A commission can start from a market question, or from a thesis and model that need a second read.
The scope of each product and its fee are published, and both are agreed in writing before work begins.
See the products and feesA different question? If this leaves your question open, or you would put it another way, write to research@inashanu.com. Questions that keep coming up shape what we study next.