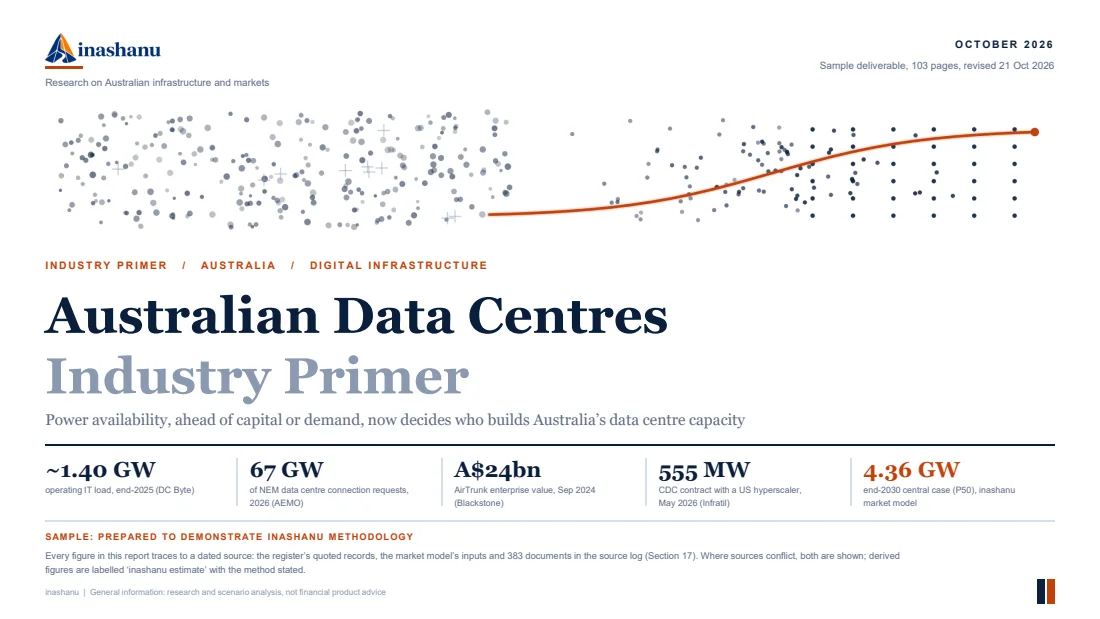
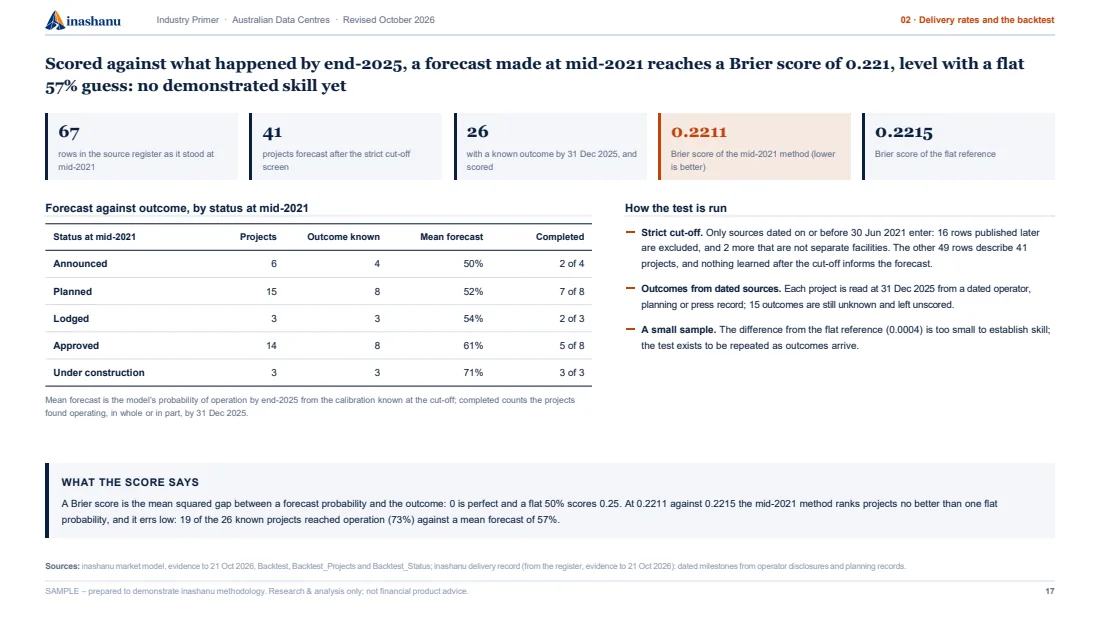
An industry primer that follows every tranche of a project register from its planning stage to operation, with completion odds from a dated delivery record, to a range for operating IT at the end of 2030. The data explorer is published with it; the workbook and the register are licensed to firms on request.
Source: inashanu Australian data centre primer. Evidence current to 21 October 2026.
The study’s files
Files published with the study
The primer and the explorer open without registration, and the primer carries the source log and the data-gap register. The workbook and the register are licensed to firms on request. The editable deck is not published; a client receives it with the primer.
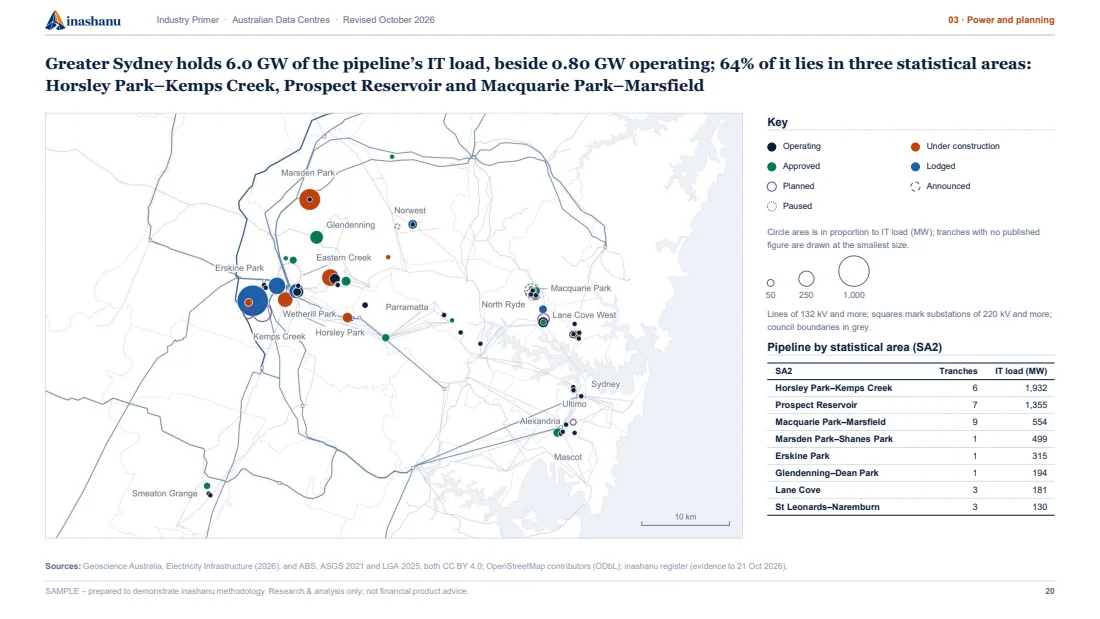
Pages from the published Australian data centre primer. As at 21 October 2026.
Prepared to demonstrate the standard applied to client work. No client information appears in it.
Licensed on request
The workbook and the register
The market model's workbook holds 86 sheets, every input sourced and dated and every
formula live, so a deal team can rerun the cases on its own judgements. The register holds
272 tranches in 230 campuses, and the delivery record
831 dated events.
Source: the inashanu market model workbook and register, evidence to 21 October 2026. Rows are shown as
the sheets show them; calculated cells are set in grey and give their formula on hover.
Data explorer
Explore the register and the range to 2030
The data explorer maps every tranche in the register against the transmission network, and sets the 2030 range beside the forecasts it is compared with.
Source: the inashanu data explorer, from the register and the market model, evidence to 21 October 2026. Views of the published explorer.
The primer as web pages
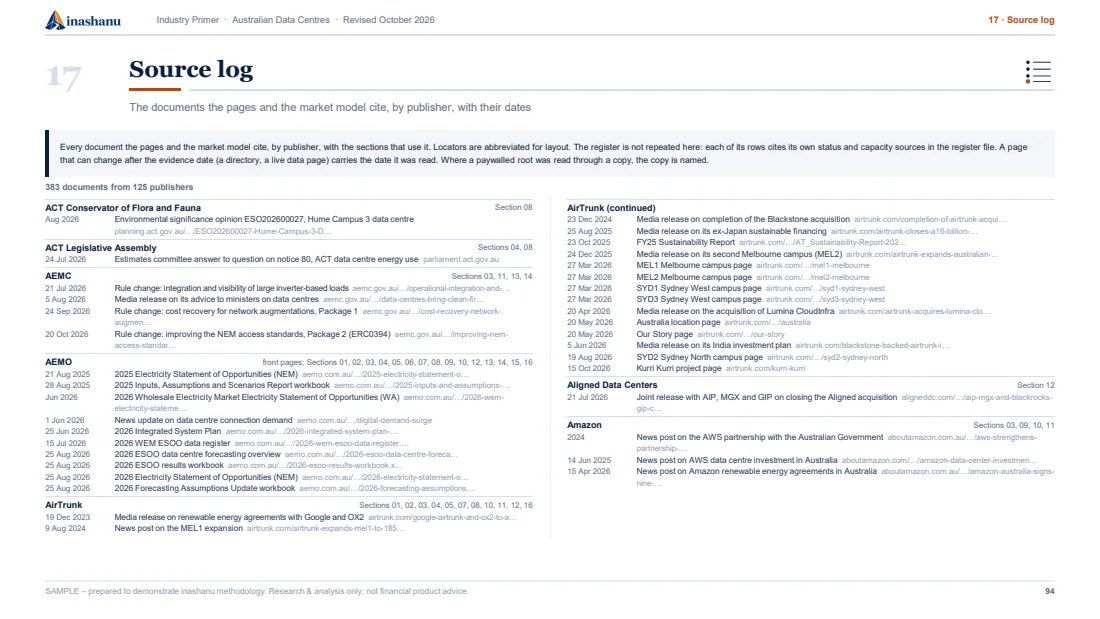
The primer is also published as 34 web pages, indexed by the question each answers. These pages set out both readings where published sources disagree, with the basis of each stated.
Source: the inashanu Australian data centre research corpus, 383 logged sources. As at 21 October 2026.
Evidence standard
What three widely quoted figures measure
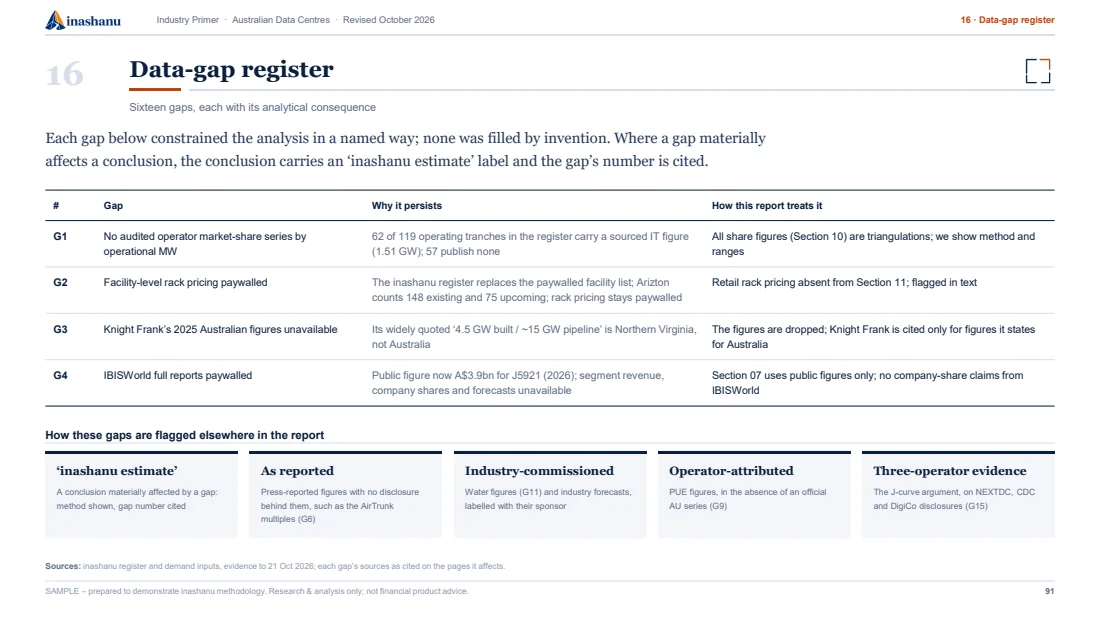
Each of these is published and widely repeated, and each measures something the headline leaves out. The primer carries both readings of each, with the basis of each stated.
AirTrunk, 2024
The same asset, valued at 21 times and at 87 times.
Multiple on the AirTrunk transaction as reported by the valuer, against about 87 times 2024 earnings reported elsewhere on the same asset. The valuer bounds its own figure to the whole business.
As reported by the valuer
21x
Multiple of contracted EBITDA on the reported transaction value, for the entire business operations.
Source: PwC Australia, Data centre valuation: The billion-dollar question. As at 10 March 2026.
Reported elsewhere, about
87x
Multiple of reported 2024 EBITDA, on the same asset.
Australian Financial Review, Chanticleer, as at 4 September 2024; whether its 2024 is a financial or a calendar year is not confirmed.
“This sale was reported to be a 21x contracted EBITDA multiple. We note that this applies to the entire business operations.”
The two figures count different earnings over different periods.
Carried in the inashanu Australian data centre primer, transaction table.
Exhibit · AirTrunk and its comparables
EV/EBITDA multiples, x: one enterprise value, two denominators
0x15x30x45x60x75x90x
DigiCo / iseek, CY25 forecast (HMC)
19x
AirTrunk, contracted run-rate (AFR)
21x
DigiCo / Global Switch AU, forecast (PDS)
25.1x
AirTrunk, 2024 EBITDA (AFR)
87x
About 4x apart: the same transaction value over contracted run-rate and over reported 2024 EBITDA
Source: AFR (3 and 4 Sep 2024, as reported); PwC Australia (10 Mar 2026); Blackstone (4 Sep 2024); HMC (11 Nov 2024); DigiCo PDS (12 Dec 2024); NEXTDC FY26 (27 Aug 2026); ASX (16 Oct 2026 close). As at 21 October 2026. Was AirTrunk bought at 21x or 87x?
The comparables
Two earlier Australian data centre transactions priced at 19 and 25.1 times EBITDA.
Source: AFR (3 and 4 Sep 2024, as reported); PwC Australia (10 Mar 2026); Blackstone (4 Sep 2024); HMC (11 Nov 2024); DigiCo PDS (12 Dec 2024); NEXTDC FY26 (27 Aug 2026); ASX (16 Oct 2026 close). As at 21 October 2026.
As reported by the valuer
On contracted run-rate EBITDA, AirTrunk prices at 21x, between them.
PwC bounds its figure to the entire business operations.
Reported elsewhere
On its reported 2024 EBITDA, the same transaction value is about 87x.
The gap between the two is about four times, and it comes from the denominator alone.
Committee guidance
Quote both multiples with their denominators. '21x' without 'contracted run-rate' overstates comparability with listed comparables; '87x' without its year suggests a price that contracted cash flows may not support. Both are press reports: AirTrunk and its owners disclosed neither.
Operating IT load, 2025 to 2030
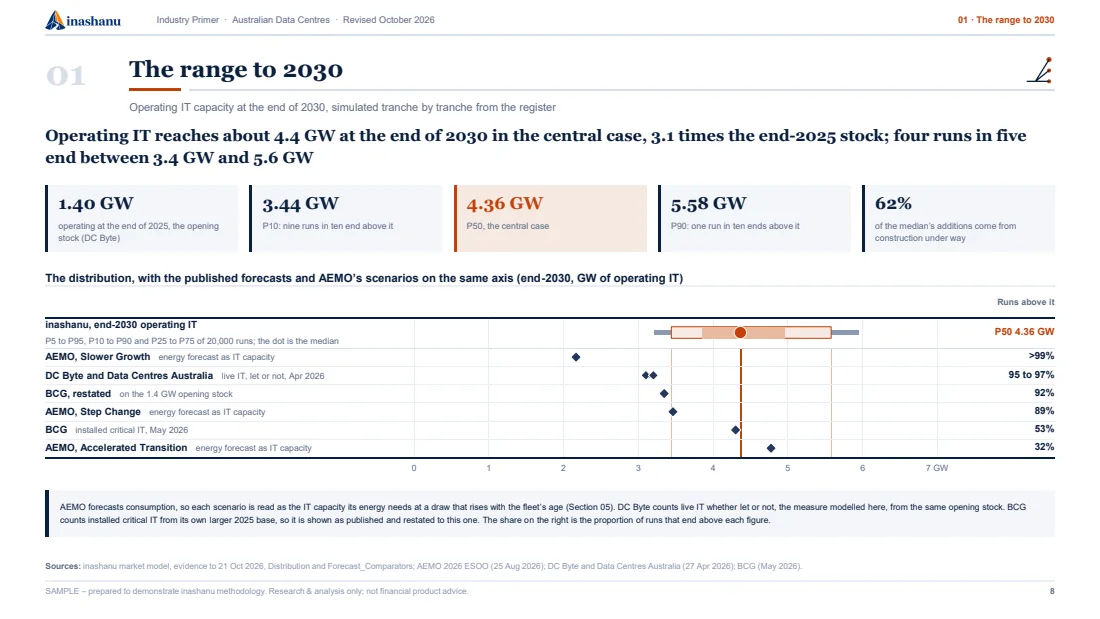
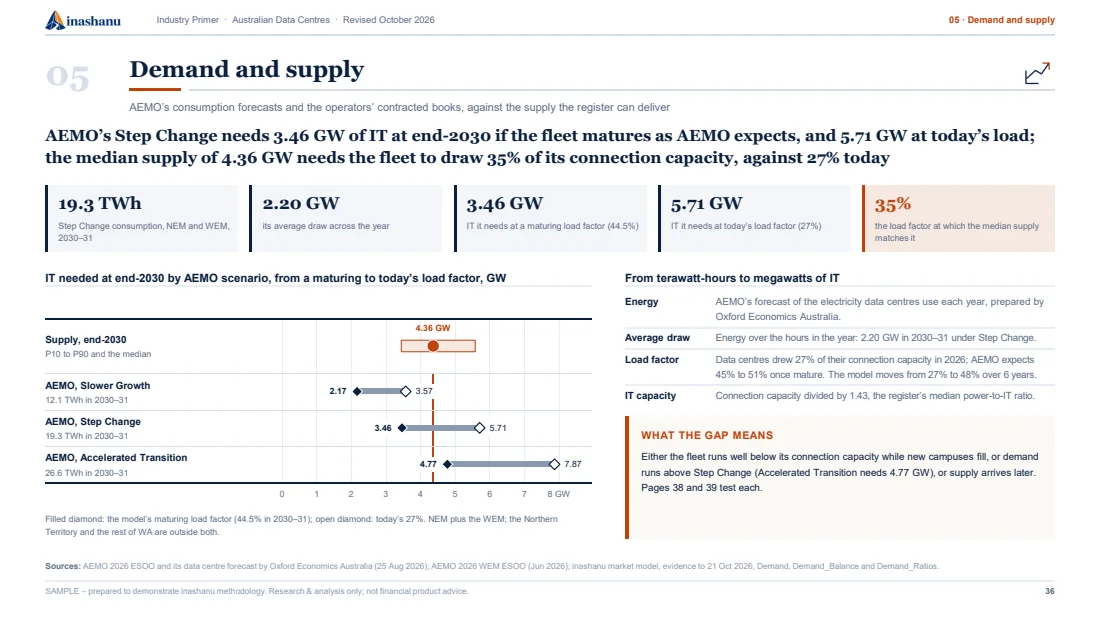
1,400 MW of operating IT load at the end of 2025, and a central case (P50) of 4,364 MW at the end of 2030.
The chart starts from the 1,400 MW of operational IT that DC Byte and Data Centres Australia report for the end of 2025, a count that includes capacity built and not yet let. It is the stock the market model’s runs start from. Source: DC Byte and Data Centres Australia, Australian Data Centre Forecast Report, Issue 1. As at 27 April 2026.
The end-2030 range is an inashanu estimate, modelled from the register’s 272 tranches: a P10 of 3,440 MW, a central case (P50) of 4,364 MW and a P90 of 5,578 MW. Source: inashanu market model, evidence to 21 October 2026, read from the published data explorer. As at 21 October 2026.
AEMO counts 2.22 GW of connection capacity for operating NEM data centres in 2026. That is site power, which includes cooling and the rest of each facility's load: at the register's ratio of 1.43, it is about 1.55 GW of IT, against the 1.49 GW the register counts in the NEM. Source: AEMO 2026 ESOO (25 Aug 2026); inashanu register (21 Oct 2026). As at 21 October 2026. How the 1.4 GW and 2.22 GW figures are counted
Australian data centre operating IT load, central case (P50), megawatts
6 year-end values of Australian data centre operating IT load, all on one basis, rising from 1,400 megawatts at the end of 2025 to a central case (P50) of 4,364 megawatts at the end of 2030, with a P10 of 3,440 megawatts and a P90 of 5,578 megawatts. 1,400 megawatts at 2025 is classified reported, source DC Byte and Data Centres Australia, Australian Data Centre Forecast Report, Issue 1, as at 27 April 2026. 1,580 megawatts at 2026 is classified an inashanu estimate, source inashanu market model, evidence to 21 October 2026, The range to 2030, P50 at the end of 2026, as at 21 October 2026. 2,224 megawatts at 2027 is classified an inashanu estimate, source inashanu market model, evidence to 21 October 2026, The range to 2030, P50 at the end of 2027, as at 21 October 2026. 3,199 megawatts at 2028 is classified an inashanu estimate, source inashanu market model, evidence to 21 October 2026, The range to 2030, P50 at the end of 2028, as at 21 October 2026. 3,874 megawatts at 2029 is classified an inashanu estimate, source inashanu market model, evidence to 21 October 2026, The range to 2030, P50 at the end of 2029, as at 21 October 2026. 4,364 megawatts at 2030 is classified an inashanu estimate, source inashanu market model, evidence to 21 October 2026, The range to 2030, central case (P50) at the end of 2030, as at 21 October 2026. 3,440 megawatts at 2030 is classified an inashanu estimate, source inashanu market model, evidence to 21 October 2026, The range to 2030, P10 at the end of 2030, as at 21 October 2026. 5,578 megawatts at 2030 is classified an inashanu estimate, source inashanu market model, evidence to 21 October 2026, The range to 2030, P90 at the end of 2030, as at 21 October 2026. Held off the axis and not plotted: 4,300 megawatts at 2030, classified flagged, on Installed critical IT load (market capacity), megawatts, source Boston Consulting Group, Australia's Digital Infrastructure Challenge, as at May 2026. The publisher counts installed critical IT load, its measure of market capacity; the axis counts operating IT load.
20251,400
20261,580
20272,224
20283,199
20293,874
2030 P504,364
2030 P103,440
2030 P905,578
Australian data centre operating IT load, central case (P50), megawatts. Source: inashanu market model, evidence to 21 October 2026. As at 21 October 2026.
Held off the axis
Boston Consulting Group puts Australian data centre capacity at 4,300 MW in 2030, counting installed critical IT load, its measure of market capacity, in Australia's Digital Infrastructure Challenge, as at May 2026.
Applied to the 1,400 MW opening stock this chart starts from, the publisher's growth gives 3,344 MW for 2030; 53 per cent of the model's 20,000 runs end above 4,300 MW and 92 per cent above 3,344 MW, as at 21 October 2026.
Source
Sources: Boston Consulting Group, Australia's Digital Infrastructure Challenge, as at May 2026; the restatement and the shares of runs, inashanu market model, evidence to 21 October 2026, read from the published data explorer.
Australian data centre operating IT load, central case (P50), megawatts. Source: inashanu market model, evidence to 21 October 2026. As at 21 October 2026.
End-2025 opening stock 1,400 MW on Operating IT load, national, megawatts. Source: DC Byte and Data Centres Australia, Australian Data Centre Forecast Report, Issue 1. As at 27 April 2026.
Pipeline, 2026
Exhibit · the pipeline
The pipeline, counted at site power and at IT load, GW
0204060
Seeking connection, AEMO (NEM)
67.1 GWRated capacity in AEMO's connection stages: every request, at site power
Pipeline, inashanu register (NEM)
38.3 GWThe register's NEM tranches not yet operating, at facility power
Pipeline, inashanu register (national)
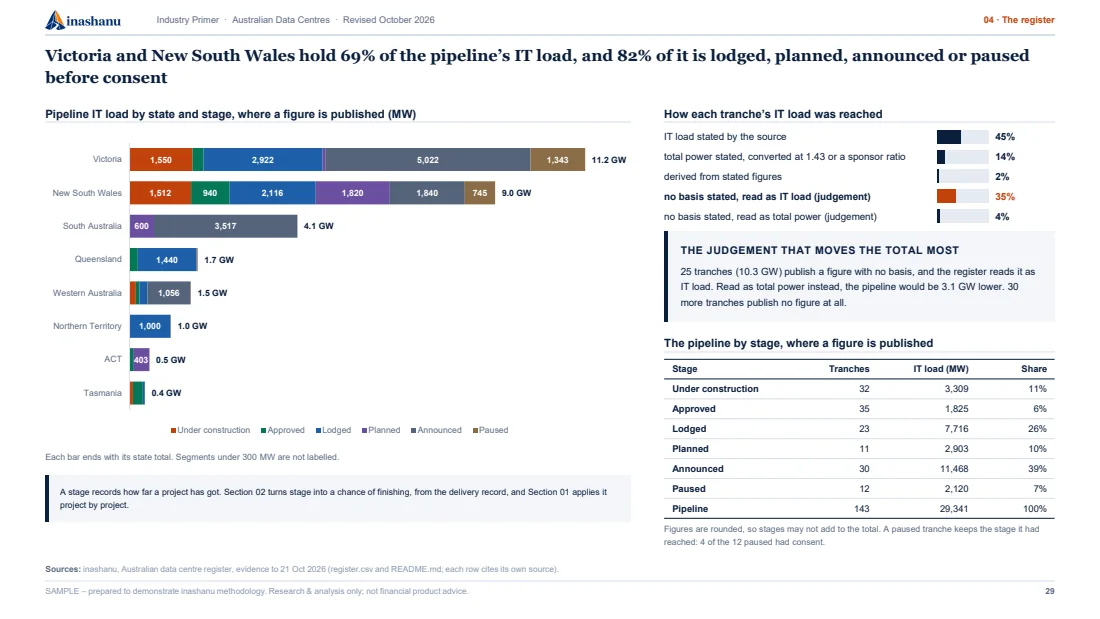
29.3 GWIT load where a figure is published: 113 of the 143 tranches not yet operating, in 133 campuses
3.44 to 5.58 GW all operating IT in Australia at the end of 2030, including what runs today, P10 to P90; central case (P50) 4.36 GW
Source: AEMO 2026 ESOO (25 Aug 2026); inashanu register (21 Oct 2026). As at 21 October 2026. The inashanu range: inashanu market model, evidence to 21 October 2026, read from the published data explorer. As at 21 October 2026. How much of the register’s pipeline will be operating by 2030?
Every request
67.1 GW of rated capacity sits in AEMO’s connection stages for NEM data centres: every request, counted at site power.
Source: AEMO 2026 ESOO (25 Aug 2026); inashanu register (21 Oct 2026). As at 21 October 2026.
The register’s pipeline
The register names 38.3 GW of it at facility power, 57% of AEMO’s count. Across the country its pipeline holds 29.3 GW of IT load where a figure is published.
Odds of completion
Oxford Economics puts a proposed project’s median chance of completion at 28%, which is why the register’s pipeline is weighted by stage rather than added up.
Source: Oxford Economics for AEMO (25 Aug 2026).
Operating at the end of 2030
4.36 GW: the inashanu central case (P50) for all operating IT in Australia at the end of 2030, in a range of 3.44 to 5.58 GW from P10 to P90.
It counts the capacity running today as well as what the register’s pipeline adds by then.
Source: inashanu market model, evidence to 21 October 2026. As at 21 October 2026.
Every figure on this page carries a source and a date.
The figures here are drawn from the published primer and from the public registers behind it. The table at the end of the page lists each figure with what it counts.
Where a figure is an estimate produced by us, it is identified as an estimate and the basis is stated.
1,400 MW
Australian operating data centre IT capacity at the end of 2025, including capacity built and not yet let.
Basis: Operating IT load, national, megawatts.
Source: DC Byte and Data Centres Australia, Australian Data Centre Forecast Report, Issue 1. As at 27 April 2026. The opening stock of the inashanu market model, as the published data explorer states it.
Multiple on the AirTrunk transaction as reported by the valuer, against about 87 times 2024 earnings reported elsewhere on the same asset. The valuer bounds its own figure to the whole business.
Basis: Multiple of contracted EBITDA on the reported transaction value, for the entire business operations.
“This sale was reported to be a 21x contracted EBITDA multiple. We note that this applies to the entire business operations.”
Source: PwC Australia, Data centre valuation: The billion-dollar question. As at 10 March 2026. Carried in the inashanu Australian data centre primer, transaction table.
Australian operating data centre IT capacity at the end of 2030 in the central case (P50) of 20,000 runs of the register's 272 tranches.
Basis: Operating IT load, national, megawatts.
Source: inashanu market model, evidence to 21 October 2026, The range to 2030, central case (P50) at the end of 2030. As at 21 October 2026. Published in the data explorer, with its P10 and P90.
The published study shows the standard. A commissioned assignment starts from the decision it has to inform, and its scope and deliverables are agreed in writing before work begins.
A different question? If this leaves your question open, or you would put it another way, write to research@inashanu.com. Questions that keep coming up shape what we study next.
Need this updated? Every figure here carries its date. If a decision needs it brought up to date, write to research@inashanu.com.